Energy Data 2025: EIA Statistics, Global Energy Trends & Synthetic Data for the Energy Transition
The world’s energy system is undergoing the fastest transformation in modern history — and the organisations that will lead the energy transition are those that can move from raw energy data to actionable AI models faster than their competitors. Northhaven Analytics now generates synthetic energy datasets that make this possible without regulatory exposure.
The global energy landscape of 2025 is defined by three simultaneous forces pulling in competing directions: the urgent need to decarbonise through renewable energy deployment, the persistent dependence on fossil fuels driven by geopolitical tensions and energy security concerns, and the data revolution that is transforming how energy markets, grid operators, and policy institutions understand and manage the entire energy system. At the centre of this transformation is the question of energy data — who has it, who can use it safely, and who can turn it into the actionable insights that will define the winners of the energy transition.
The State of Global Energy Data in 2025
Understanding the world energy system requires access to the most comprehensive energy statistics ever assembled. The Energy Information Administration — commonly known as the EIA — has been the gold standard for official energy statistics in the United States since 1977, publishing everything from weekly gasoline and heating oil inventories to long-range outlook projections for electricity generation, natural gas consumption, and coal trade. Internationally, the International Energy Agency (IEA) performs an equivalent function across OECD member states and beyond, publishing its annual World Energy Outlook that has become the most cited reference document in global energy policy.
The data explorer tools that these institutions now offer represent a quantum leap in accessibility to energy data. The EIA’s open data API alone contains more than 1.3 million time series covering everything from wellhead natural gas prices to hourly electricity demand by region. Yet despite this wealth of data and statistics, the organisations that most need to use this data for AI development — utilities, energy traders, grid operators, and electric vehicle infrastructure providers — face a paradox familiar to every data-intensive industry: the most valuable data is also the most operationally sensitive, the most commercially confidential, and the most difficult to use safely at scale.
The Global Energy Mix: Where We Stand in 2025
Despite years of transition rhetoric and genuine progress in solar and wind and solar deployment, the global energy supply in 2025 remains dominated by fossil fuels. Coal, natural gas, and fuel oil together account for approximately 80% of total energy consumption worldwide — a figure that has barely moved in a decade despite the dramatic fall in the cost of renewable energy technologies. The challenge is not that renewables are uncompetitive — it is that the energy system has enormous inertia, and the integration of variable renewable generation into existing grid infrastructure requires sophisticated data-driven management that most operators are still developing.
According to the Energy Information Administration, U.S. electricity generation from renewable sources surpassed nuclear for the first time in 2022 and has continued to grow. However, natural gas remains the single largest source of U.S. electricity, accounting for approximately 43% of total generation in 2024. The data and research from the EIA’s monthly Electric Power Monthly provides the most detailed picture of this energy mix evolution available to any public institution.
Energy Sources Deep Dive: From Fossil to Clean Energy
Natural gas remains the world’s most important transition fuel — cleaner than coal in terms of CO2 emissions, flexible enough to complement variable renewables, and globally traded via a growing LNG infrastructure that has fundamentally reshaped energy geopolitical tensions since 2022.
The EIA projects global natural gas demand will peak between 2030 and 2035 in its base case outlook, driven by declining consumption in developed economies offset by continued growth in Asia. The volatility in TTF and Henry Hub gas prices since 2021 has made synthetic gas price time-series datasets one of the most in-demand products in energy analytics.
Coal consumption tells one of the most geographically split stories in the global energy transition. In the U.S. and Europe, coal’s role in electricity generation has collapsed — falling from over 50% in the U.S. in 2005 to under 17% by 2024. But globally, coal consumption hit a record high in 2023, driven by demand in China, India, and Southeast Asia.
Coal remains critical for energy statistics professionals to model, since it represents both the highest CO2 emissions intensity of any fossil fuel and the largest source of dispatchable baseload generation in many economies.
Solar power is the undisputed champion of the energy transition in terms of deployment velocity. The IEA describes solar as „the new king of electricity markets” — with the cost of utility-scale solar falling 90% in the past decade and new capacity additions breaking records every year. In 2024, global solar added more new capacity than all other energy sources combined.
The challenge for AI systems managing solar integration is the intermittency of generation — creating enormous demand for synthetic solar generation profiles that capture the full range of weather scenarios, including the rare cloudy-day and heat-stress events that stress grid management systems.
Nuclear energy is experiencing a policy renaissance in 2025. After decades of stagnation following Fukushima, new nuclear capacity is under construction in China, India, South Korea, and — for the first time in decades — several Western countries. The U.S. Inflation Reduction Act included significant incentives for existing and new nuclear generation, recognising its role as the only large-scale, weather-independent clean energy source available at scale.
Advanced reactor designs — including small modular reactors (SMRs) — are creating new demands for operational simulation data that is currently impossible to generate from real operational experience, since many of these reactor designs have never been built.
Wind and solar together now account for the majority of new renewable capacity additions globally, with wind providing a more consistent generation profile than solar in many regions. Onshore wind is now the cheapest source of electricity in most markets. Offshore wind is more expensive but provides access to stronger, more consistent wind resources and avoids land use conflicts.
Geothermal energy remains one of the most underutilised clean energy resources in the world — providing constant, weather-independent electricity generation from the Earth’s internal heat. Despite its advantages, geothermal deployment has been constrained by high upfront drilling costs and geographic limitations. Advanced geothermal systems (AGS) are changing this, with companies like Quaise Energy pursuing enhanced geothermal approaches that could dramatically expand the addressable resource.
Biofuel occupies a complex and contested space in the global energy mix. As a liquid fuel that can replace diesel and gasoline in existing vehicle fleets without infrastructure changes, it offers an immediate decarbonisation pathway for transport. However, land use concerns, food-versus-fuel debates, and highly variable lifecycle emission profiles make biofuels one of the most difficult energy sources to analyse and regulate. The EIA tracks biofuel production and import/export data extensively as part of its Petroleum Supply Monthly.
LNG (Liquefied Natural Gas) has fundamentally transformed global energy markets since 2022, when Russia’s invasion of Ukraine forced Europe to rapidly replace pipeline gas with seaborne LNG from the U.S., Qatar, and Australia. The result has been an unprecedented period of price volatility, new supply chain development, and accelerated investment in both LNG export and import terminals. The U.S. has become the world’s largest LNG exporter, with the Department of Energy’s Office of Fossil Energy tracking every shipment.
The Energy Transition: Data, CO2 Emissions, and the Race to Net Zero
The energy transition is not a single event — it is a decades-long restructuring of the global economy energy data infrastructure, driven by the need to reduce CO2 emissions and greenhouse gas emissions before the consequences of climate change become unmanageable. The International energy agencies that track this transition — the IEA, IRENA, and the U.S. EIA — publish data and research that is increasingly the foundation for investment decisions, regulatory frameworks, and corporate net-zero strategies around the world.
Global energy-related CO2 emissions run at approximately 37 billion tonnes per year — equivalent to roughly 1,173 tonnes every second. The challenge of tracking, modelling, and reducing these CO2 emissions requires more sophisticated energy data infrastructure than any previous generation of analysts has had access to.
Energy Efficiency: The First Fuel
Energy efficiency is consistently identified by the IEA as the largest single lever available for reducing emission trajectories in the near term. Yet energy efficiency improvements are notoriously difficult to measure, predict, and attribute — requiring granular data on energy consumption patterns at the building, industrial process, and appliance level that is rarely available in a form that can be used for AI model training.
The trend in global energy efficiency improvement has been positive but insufficient. The IEA’s Tracking Clean Energy Progress report documents annual efficiency improvements of approximately 2% — against the 4% needed to reach net-zero pathways by 2050. The gap between what is possible and what is happening represents both a policy failure and a data gap — one that synthetic energy consumption datasets can help bridge by enabling the modelling of efficiency improvement scenarios that have not yet occurred in the real world.
Electric Vehicles and the Transformation of Energy Demand
The electric vehicle revolution is one of the most significant structural shifts in energy consumption patterns in modern history. The replacement of gasoline and diesel combustion in passenger transport with battery-electric drivetrains does not reduce energy use — it shifts the source from the forecourt to the grid. This creates entirely new patterns of electricity demand — particularly the evening peak charging load that represents one of the most significant grid management challenges of the coming decade.
Building AI systems to manage electric vehicle charging optimisation requires training data that captures the full distribution of charging behaviours, vehicle types, grid conditions, and price signals that will characterise the 2025–2035 transition period. Much of this data does not yet exist in sufficient volume or diversity from real operational experience — making synthetic EV charging datasets one of the most immediately valuable applications of our energy data generation capabilities at Northhaven Analytics.
A Decade of Energy Transformation: 2015–2025
The energy statistics of the past decade tell the story of one of the most consequential economic transitions in human history. Drag the timeline to explore how key world energy metrics have evolved from the signing of the Paris Agreement through to the current moment.
Energy Markets, Price Volatility, and the Need for Synthetic Data
Energy markets have experienced extraordinary volatility in the period from 2021 to 2025. The convergence of post-pandemic demand recovery, geopolitical tensions following Russia’s invasion of Ukraine, supply chain disruptions, and the structural changes driven by the energy transition created price movements in natural gas, electricity, coal, and diesel that were unprecedented in their speed and magnitude. European TTF gas prices rose more than 1,000% from pre-pandemic levels before collapsing again — a pattern that broke virtually every quantitative model that energy traders and utilities had relied upon.
The problem for quantitative teams trying to build AI models for energy markets is that these extreme events — while statistically rare — are precisely the scenarios that matter most for risk management. A model that has only ever been trained on the 2018–2020 period of relatively stable energy prices will fail catastrophically when the next volatility episode arrives. Building robust models requires training data that covers the full distribution of price dynamics, including the tail events that real historical data contains in insufficient quantity for ML training.
Grid Management and Energy Storage
The grid of 2025 is fundamentally different from the grid of 2015. The rapid growth of variable renewable generation — solar and wind — has transformed the operational challenge facing every electricity system operator. Where grid management was once primarily a question of matching dispatchable generation to demand, it is now a complex optimisation problem involving variable generation, demand response, energy storage, cross-border interconnection, and real-time pricing signals.
Energy storage is at the centre of this transformation. Battery storage capacity has grown from effectively zero in 2015 to more than 200 GWh globally by 2024, and projections from the EIA and IEA suggest this will grow tenfold by 2030. Training AI systems to optimise energy storage dispatch — deciding when to charge, when to discharge, and how to arbitrage between different price periods — requires synthetic training data that captures the full complexity of grid conditions, including the rare but high-impact events that stress storage systems most severely.
The IEA estimates that achieving net-zero electricity systems globally by 2050 will require approximately 14,000 GW of flexible capacity — from storage, demand response, and grid interconnection. The AI systems needed to manage this flexibility require training on scenarios that do not yet exist in real operational data. This is precisely the gap that Northhaven synthetic energy datasets are designed to fill.
Energy Prices and the Affordability Challenge
Alongside the technical challenges of the energy transition, energy prices have become one of the defining political issues of the 2020s. The energy-related inflation that swept through OECD economies in 2022 and 2023 — driven by gas prices, then electricity, then gasoline and diesel — exposed the vulnerability of households and businesses to global energy supply disruptions in a way that no amount of data and research had adequately prepared policymakers for. Modelling the distributional impacts of energy price spikes — which households are most vulnerable, which sectors of the economy are most exposed — requires granular data on energy consumption patterns that is extraordinarily difficult to access through official channels.
How Northhaven Analytics Generates Synthetic Energy Data
We generate synthetic energy data at enterprise scale
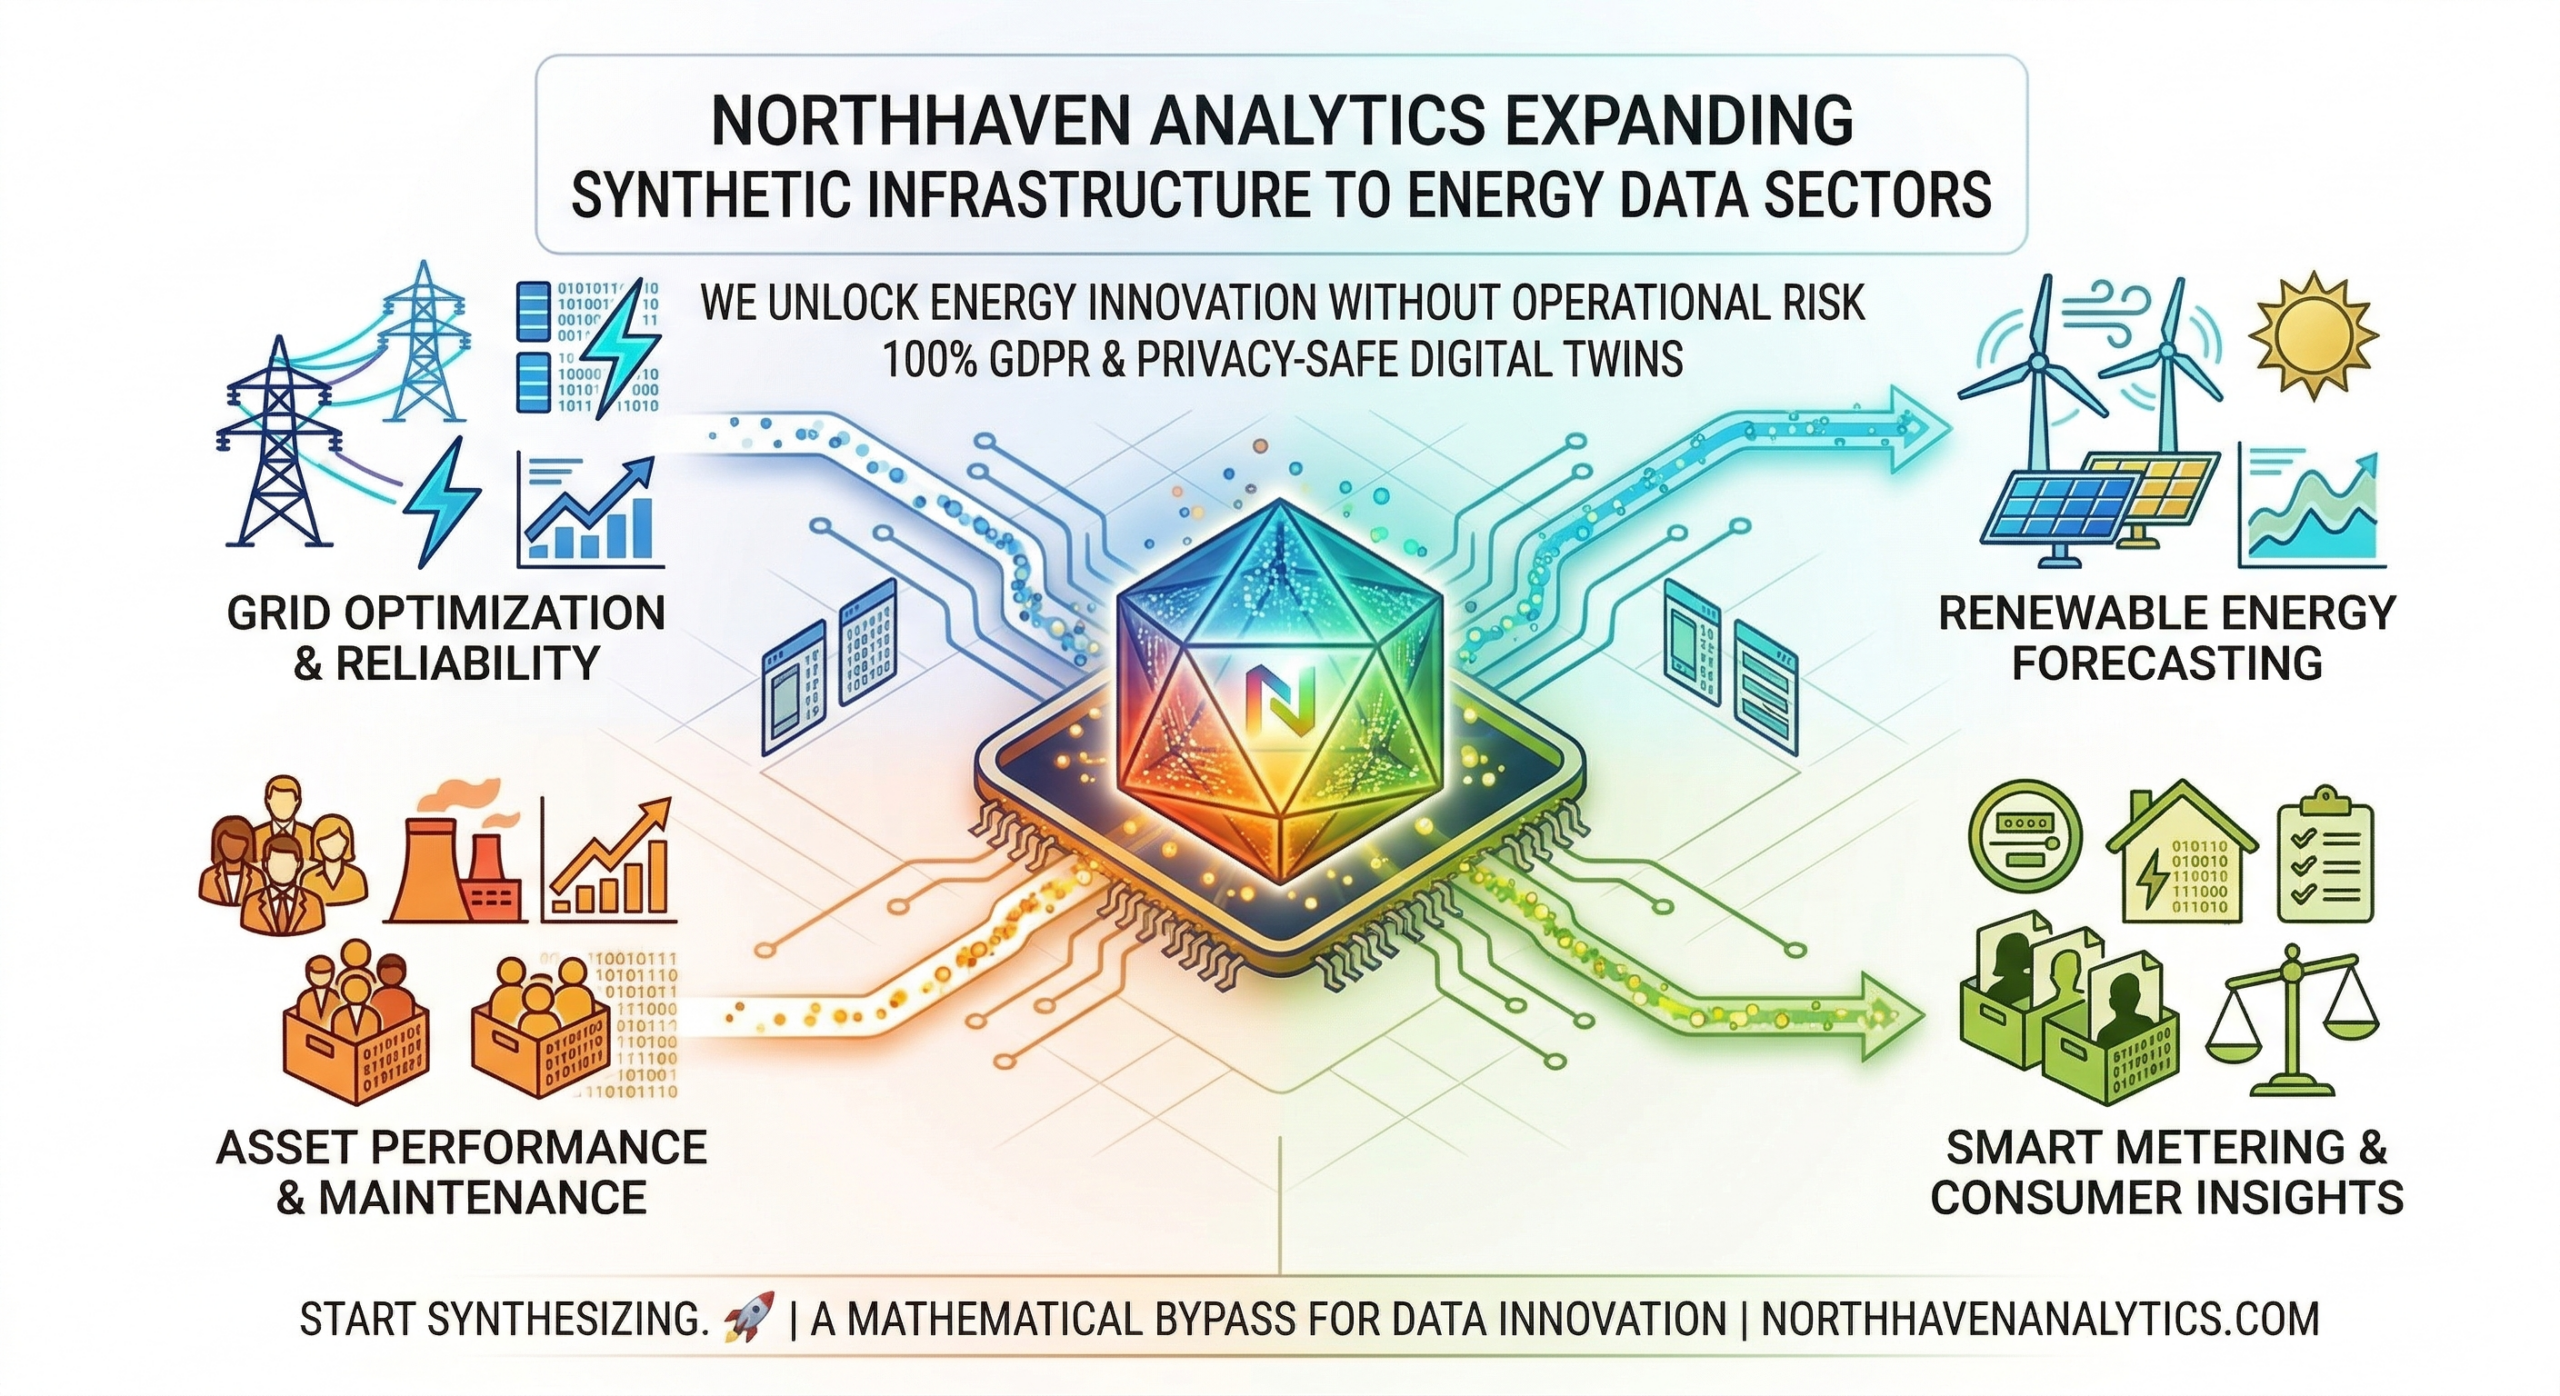
Northhaven Analytics has expanded its synthetic data generation capabilities to the energy sector. Building on proven infrastructure in financial services, MedTech, and telecommunications, we now generate statistically precise synthetic datasets covering electricity generation profiles, gas price time-series, grid telemetry, demand response signals, EV charging patterns, and energy storage dispatch data — without containing a single real operational record. Our synthetic energy datasets are production-ready and deployable in weeks.
The energy sector presents a unique combination of data sensitivity and complexity. Grid telemetry, real-time electricity pricing, gas liquids trading records, plant operational parameters, and reserve margin data all contain commercially sensitive and operationally critical information that cannot be shared with third-party analytics providers or used to train externally-deployed AI models without careful governance. At the same time, the AI capabilities that energy companies need most urgently — predictive maintenance, demand forecasting, price optimisation, emission attribution — all require high-quality training data that the governance constraints around real operational data systematically prevent from being assembled.
The EIA, IEA, and the Architecture of Official Energy Statistics
The Energy Information Administration — the statistical and analytical arm of the U.S. Department of Energy’s Office of Energy Information — publishes the most comprehensive set of domestic energy statistics available to the public. Its data explorer platform gives analysts and researchers access to time-series data stretching back decades on every aspect of U.S. energy use, from the wellhead to the consumer, covering electricity, natural gas, coal, petroleum, nuclear, and renewable sources.
The EIA’s flagship publications — the Annual Energy Outlook (AEO), the Short-Term Energy Outlook (STEO), and the Monthly Energy Review — provide the projection and trend data that feeds into virtually every energy investment decision, regulatory process, and policy analysis in the U.S. Internationally, the IEA’s World Energy Outlook performs an equivalent function, synthesising data and statistics from more than 150 countries into the most widely cited global energy reference publication in the world.
| Institution | Jurisdiction | Key Publications | Data Access | Update Frequency |
|---|---|---|---|---|
| EIA (U.S.) | United States | AEO, STEO, Monthly Energy Review | Open API | Monthly / Annual |
| IEA | OECD + Associates | World Energy Outlook, Renewables Report | Partial Open | Monthly / Annual |
| IRENA | Global | Renewable Capacity Statistics | Open Data | Annual |
| Eurostat | European Union | Energy Balance, Electricity Statistics | Open Data | Monthly / Annual |
| BP Statistical Review | Global | World Energy Statistical Review | Open Data | Annual |
| ENTSO-E | European Grid | Transparency Platform | Open Data | Hourly / Daily |
The Limits of Official Energy Data for AI Development
While the open data infrastructure built by the EIA and its international counterparts represents an extraordinary public resource, it has fundamental limitations as a training data source for commercial AI applications. The aggregation level at which official energy statistics are published — regional, monthly, by broad fuel category — is far too coarse for training the granular ML models that energy companies need to operate competitively. A utility that wants to build an AI system for real-time demand forecasting at the substation level cannot use EIA state-level monthly data to train it.
This is the gap that Northhaven’s synthetic dataset generation fills — creating high-resolution, operationally realistic energy data that preserves the statistical properties of real data while being fully safe to share, use in cloud environments, and expose to third-party analytics providers.
Use Cases: Synthetic Energy Data in Practice
Electricity wholesale price forecasting is one of the most technically demanding applications in quantitative finance. Prices can move by factors of 10 or more within a single hour in response to unexpected generation outages, demand spikes, or interconnector failures. Training AI models that can anticipate these extreme moves requires training data that contains them — but real price spike events are, by definition, rare. Northhaven generates synthetic electricity price series with configurable spike frequency and magnitude, covering day-ahead, intraday, and balancing market dynamics across major European and U.S. electricity markets.
The intermittency of wind and solar generation creates one of the most significant operational challenges in modern grid management. Short-term generation forecasting — predicting how much solar and wind output will be available 1–48 hours ahead — is critical for unit commitment decisions, reserve procurement, and intraday trading. AI systems trained for this purpose need to have encountered the full range of weather scenarios their real-world counterparts will face — including the rare but high-impact events like sudden cloud cover, heat-induced panel efficiency losses, and wind ramp events that are systematically underrepresented in historical datasets.
Energy storage assets — battery storage, pumped hydro, and compressed air — are only as valuable as the dispatch strategies that operate them. Training reinforcement learning agents to optimise energy storage dispatch across different market conditions, price regimes, and grid states requires exposure to thousands of simulated market days that would take decades to accumulate from real operation. Northhaven generates synthetic grid and price environments that allow storage operators to train dispatch AI agents across the full range of operational scenarios without waiting for real market experience to accumulate.
CO2 emissions attribution — particularly the complex task of assigning carbon responsibility across extended supply chains — is one of the most analytically demanding problems in corporate sustainability reporting. Building AI systems that can automate scope 3 emissions calculation requires training data that spans the full complexity of supply chain structures, procurement patterns, and emissions factors across different energy sources and geographies. Northhaven generates synthetic supply chain and emissions datasets that enable AI-driven carbon accounting systems to be built and validated without requiring access to commercially sensitive supplier data.
As electric vehicle penetration grows and smart meter deployment accelerates, demand response programmes are becoming one of the most important tools available to grid operators for managing electricity demand peaks. Building the AI systems that can optimise demand response — predicting which customers will respond to price signals, by how much, and under what conditions — requires training data on consumer behaviour that is extraordinarily sensitive from a privacy perspective. Synthetic consumer demand datasets that preserve the statistical properties of real response patterns without containing any real customer data are ideal for this application.
The events of 2022 demonstrated that geopolitical tensions can reshape global energy supply patterns within weeks — with consequences for energy prices, supply chain resilience, and national energy security that propagate through every connected market. Building AI systems capable of modelling these scenario outcomes — what happens to European electricity prices if Middle Eastern LNG is disrupted? How does a conflict affecting the Strait of Hormuz affect global gas liquids markets? — requires synthetic geopolitical scenario data that cannot exist in real historical records because these specific events have not yet occurred.
Energy Access, Equity, and the Data Gap in Developing Economies
Access to energy remains one of the most profound development challenges of the 21st century. Approximately 685 million people worldwide — predominantly in sub-Saharan Africa and South and Southeast Asia — still live without access to energy in the form of reliable electricity. The IEA, IRENA, and the World Bank’s Tracking SDG7 report document the pace of electrification progress, which has accelerated significantly since 2015 but remains far short of what is needed to achieve universal electricity access by 2030.
The particular challenge for AI-driven planning of energy access solutions in developing economies is the absence of reliable baseline data. Unlike OECD countries where electricity meters, smart grid sensors, and consumption databases provide granular insight into demand patterns, off-grid and newly-electrified communities have almost no digital footprint. Building the AI models needed to optimise mini-grid design, demand forecasting for rural electrification, and solar system sizing requires synthetic demand data that captures the characteristic patterns of energy use in these communities — patterns that Northhaven can generate using demographic and climate data inputs even where no metered consumption records exist.
Northhaven Analytics is actively seeking collaboration with development finance institutions, NGOs, and government energy agencies working on energy access programmes in developing economies. Our synthetic data capabilities can support planning, simulation, and AI model development for mini-grid and off-grid electrification projects where real consumption data is unavailable. Contact us to discuss how synthetic energy data can support your programme.
Energy Data Outlook 2025–2030: Projections and Trends
The outlook for global energy data availability and quality over the 2025–2030 period is broadly positive — driven by the rapid expansion of smart metering, real-time grid monitoring, and satellite-based emission tracking. But the institutions and companies that will create competitive advantage from this data are those that build AI capabilities now — and building those capabilities requires training data that cannot wait for operational systems to accumulate it.
| Energy Data Type | Northhaven Synthetic Capability | Delivery Time | Scale |
|---|---|---|---|
| Electricity Price Time-Series (day-ahead, intraday) | GAN + GARCH hybrid — volatility-realistic | 1–2 weeks | Unlimited |
| Solar / Wind Generation Profiles | Weather-correlated, seasonal, site-specific | 1–2 weeks | Unlimited |
| Grid Telemetry (frequency, voltage, load) | Substation-level, fault event enriched | 2–3 weeks | Enterprise |
| EV Charging Load Profiles | Fleet + residential, price-responsive | 1–2 weeks | Unlimited |
| Energy Storage Dispatch Histories | Multi-market, arbitrage-realistic | 2–3 weeks | Enterprise |
| Natural Gas / LNG Price Series | TTF, Henry Hub, seasonal + geopolitical shock | 1–2 weeks | Unlimited |
| Carbon Credit & Emission Records | Supply chain attributed, scope 1/2/3 | 2–3 weeks | Enterprise |
| Off-Grid / Mini-Grid Demand Profiles | Demographic + climate driven | 1–2 weeks | Unlimited |
Ready to power your
energy AI with synthetic data?
Book a free technical consultation. We’ll scope your energy data use case and deliver a proof-of-concept synthetic dataset — NDA from day one, no real operational data required.