
In the modern digital economy, data is frequently referred to as the new oil. It is the foundational resource that powers innovation, drives enterprise growth, and fuels the rapidly expanding field of data science. But what defines this resource? How do we move from a single datum to complex artificial intelligence systems that reshape industries?
This incredibly extensive guide explores the entire lifecycle of data, from gathering data via a survey or sensor to making decisions based on insight. We will analyze different types of data, explore open data initiatives like those from the World Bank, and explain why Northhaven Analytics is the only platform capable of delivering the custom, privacy-safe data sets that financial institutions need to thrive in an era of big data.
What is the Meaning of Data in the Modern Data Economy?
To truly understand the meaning of data, we must start with the singular unit: a datum. A datum is a single piece of factual information—a value, a fact, a symbol, or a statistic. When these individual points are collected and aggregated, they become data.
Data are often described as raw facts waiting to be processed into intelligence. However, data is also increasingly seen as a critical strategic asset. Whether it is census data tracking population changes, real-time sensor readings from a factory floor, or high-frequency financial transactions, data provides the empirical evidence required for making decisions. Without data, companies are navigating blind; with it, they possess the useful information needed to predict the likelihood of market shifts.
Different Types of Data: Analyzing Quantitative and Qualitative Information
Data comes in many forms, and understanding different types of data is crucial for data analysts who wish to analyze information effectively.
Understanding Quantitative Data, Calculation, and Discrete Metrics
Quantitative data is numerical and objective. It deals with amounts of data, rigorous calculation, and precise statistical measurement. Data analysts love quantitative sets because they can compute averages and trends easily.
- Discrete Data: This includes countable integers (e.g., the number of customers).
- Continuous Data: This includes measurable quantities that can be broken down into decimals (e.g., interest rates or time).
- Metrics: Every metric on a financial dashboard is derived from quantitative data sources.
Qualitative Insight: Examples of Data Beyond the Numbers
Qualitative data is descriptive and conceptual. It provides context and insight that numbers alone cannot. Examples of data in this category include customer feedback, interview transcripts, or the sentiment behind a innovation open data policy. While harder to structure in a database, this qualitative input is vital for understanding the „why” behind the „what.”
Big Data and the Challenge of Vast Amounts of Data
The concept of big data refers to data sets that are so voluminous and complex that traditional data processing software cannot manage them. Big data encompasses vast amounts of data flowing from different sources at high velocity. To use data of this scale, organizations need advanced analytics and powerful platform solutions like those offered by Northhaven Analytics.
The Complete Data Lifecycle: From Collection of Data to Decision-Making
The journey of data processing transforms raw data into useful information. This lifecycle is rigorous and involves several stages of methodology.
Phase 1: How Organizations Collect Data from Different Sources
The first step is the collection of data. Organizations collect data from different sources to build a comprehensive view of their operations.
- Surveys and Queries: Gathering data can involve a direct survey of customers or a web query to scrape public sentiment.
- Sensors and IoT: A sensor in a machine can provide data on performance in real-time.
- Open Data Sites: Analysts often download historical data from an open data site or a catalog provided by government bodies.
- Public Data: Institutions like the World Bank provide an extensive catalog of open data regarding global development. A World Bank indicator might track GDP or literacy, serving as a vital metric for economists tracking demographic shifts.
Phase 2: Data Processing, Database Management, and Metadata
Once data collected enters the ecosystem, it must be stored in a robust database. Data processing involves cleaning, organizing, and transforming this raw data.
- Metadata: To make data usable, we add metadata—data about data. This helps curate and structure the files, ensuring that a query yields the correct results.
- Curating Data: Data scientists curate these assets to remove errors, ensuring the dataset is reliable for modeling.
Phase 3: Data Analysis and the Role of Data Analysts
Data analysis is the engine of value creation. Data analysts use data to find hidden patterns and correlations. They analyze the data sets to determine the likelihood of future events.
- Analyzing Data: Through analyzing data, raw numbers are converted into strategic insight.
- Analytics Platforms: Advanced analytics tools allow users to compute complex algorithms and perform statistical regressions.
Phase 4: Visualization and the Dashboard for Making Decisions
Finally, results are presented via visualization tools. A dashboard translates complex code into clear charts, helping executives see data intuitively. This supports data-driven decision-making. Using data to inform strategy ensures that leaders are not guessing but making decisions based on factual information. A well-designed visualization makes the meaning of data immediately apparent to stakeholders.
The Field of Data Science: AI, Machine Learning, and Modeling
The field of data science sits at the intersection of statistics, computer science, and business. It drives innovation through artificial intelligence and machine learning.
Artificial Intelligence and the Need for High-Quality Data Sets
Artificial intelligence (AI) and machine learning are dependent on vast amounts of data. Machine learning models require high-quality training data to learn how to predict outcomes. The accuracy of an AI depends entirely on the quality of the dataset it feeds on.
- Modeling: In financial modeling, data analysts use historical data to train algorithms to detect fraud or forecast markets.
- Innovation Open Data: Many AI breakthroughs started with innovation open data initiatives, where researchers shared data sets to benchmark performance.
Using Data to Inform Innovation and Enhance Data Capabilities
To enhance data capabilities, enterprises are investing heavily in data science. They use data to create data-driven products. By analyzing data on user behavior, companies can personalize experiences. However, available data is often limited by privacy concerns, which stifles innovation.
Challenges in the Data Economy: Sensitive Information and Methodology
While open data initiatives are valuable, they often lack the granularity required for sophisticated financial modeling. Data are often incomplete, noisy, or protected by strict regulations like GDPR.
The Risks of Using Raw Data containing Sensitive Information
Enterprises face a dilemma. They need to enhance data access to build better AI, but sensitive information—such as personal financial records or census data linked to individuals—cannot be shared freely. This creates a bottleneck.
- Sensitive Information: Handling sensitive information requires a strict security methodology.
- Data Scarcity: Analysts at research firms like Forrester have noted that the lack of accessible, high-quality data is the primary barrier to AI adoption in finance.
Northhaven Analytics: The Platform for Synthetic Data Innovation
This is where Northhaven Analytics changes the game. We are the only platform for Custom Synthetic Financial Data and Purpose-Built ML Models.
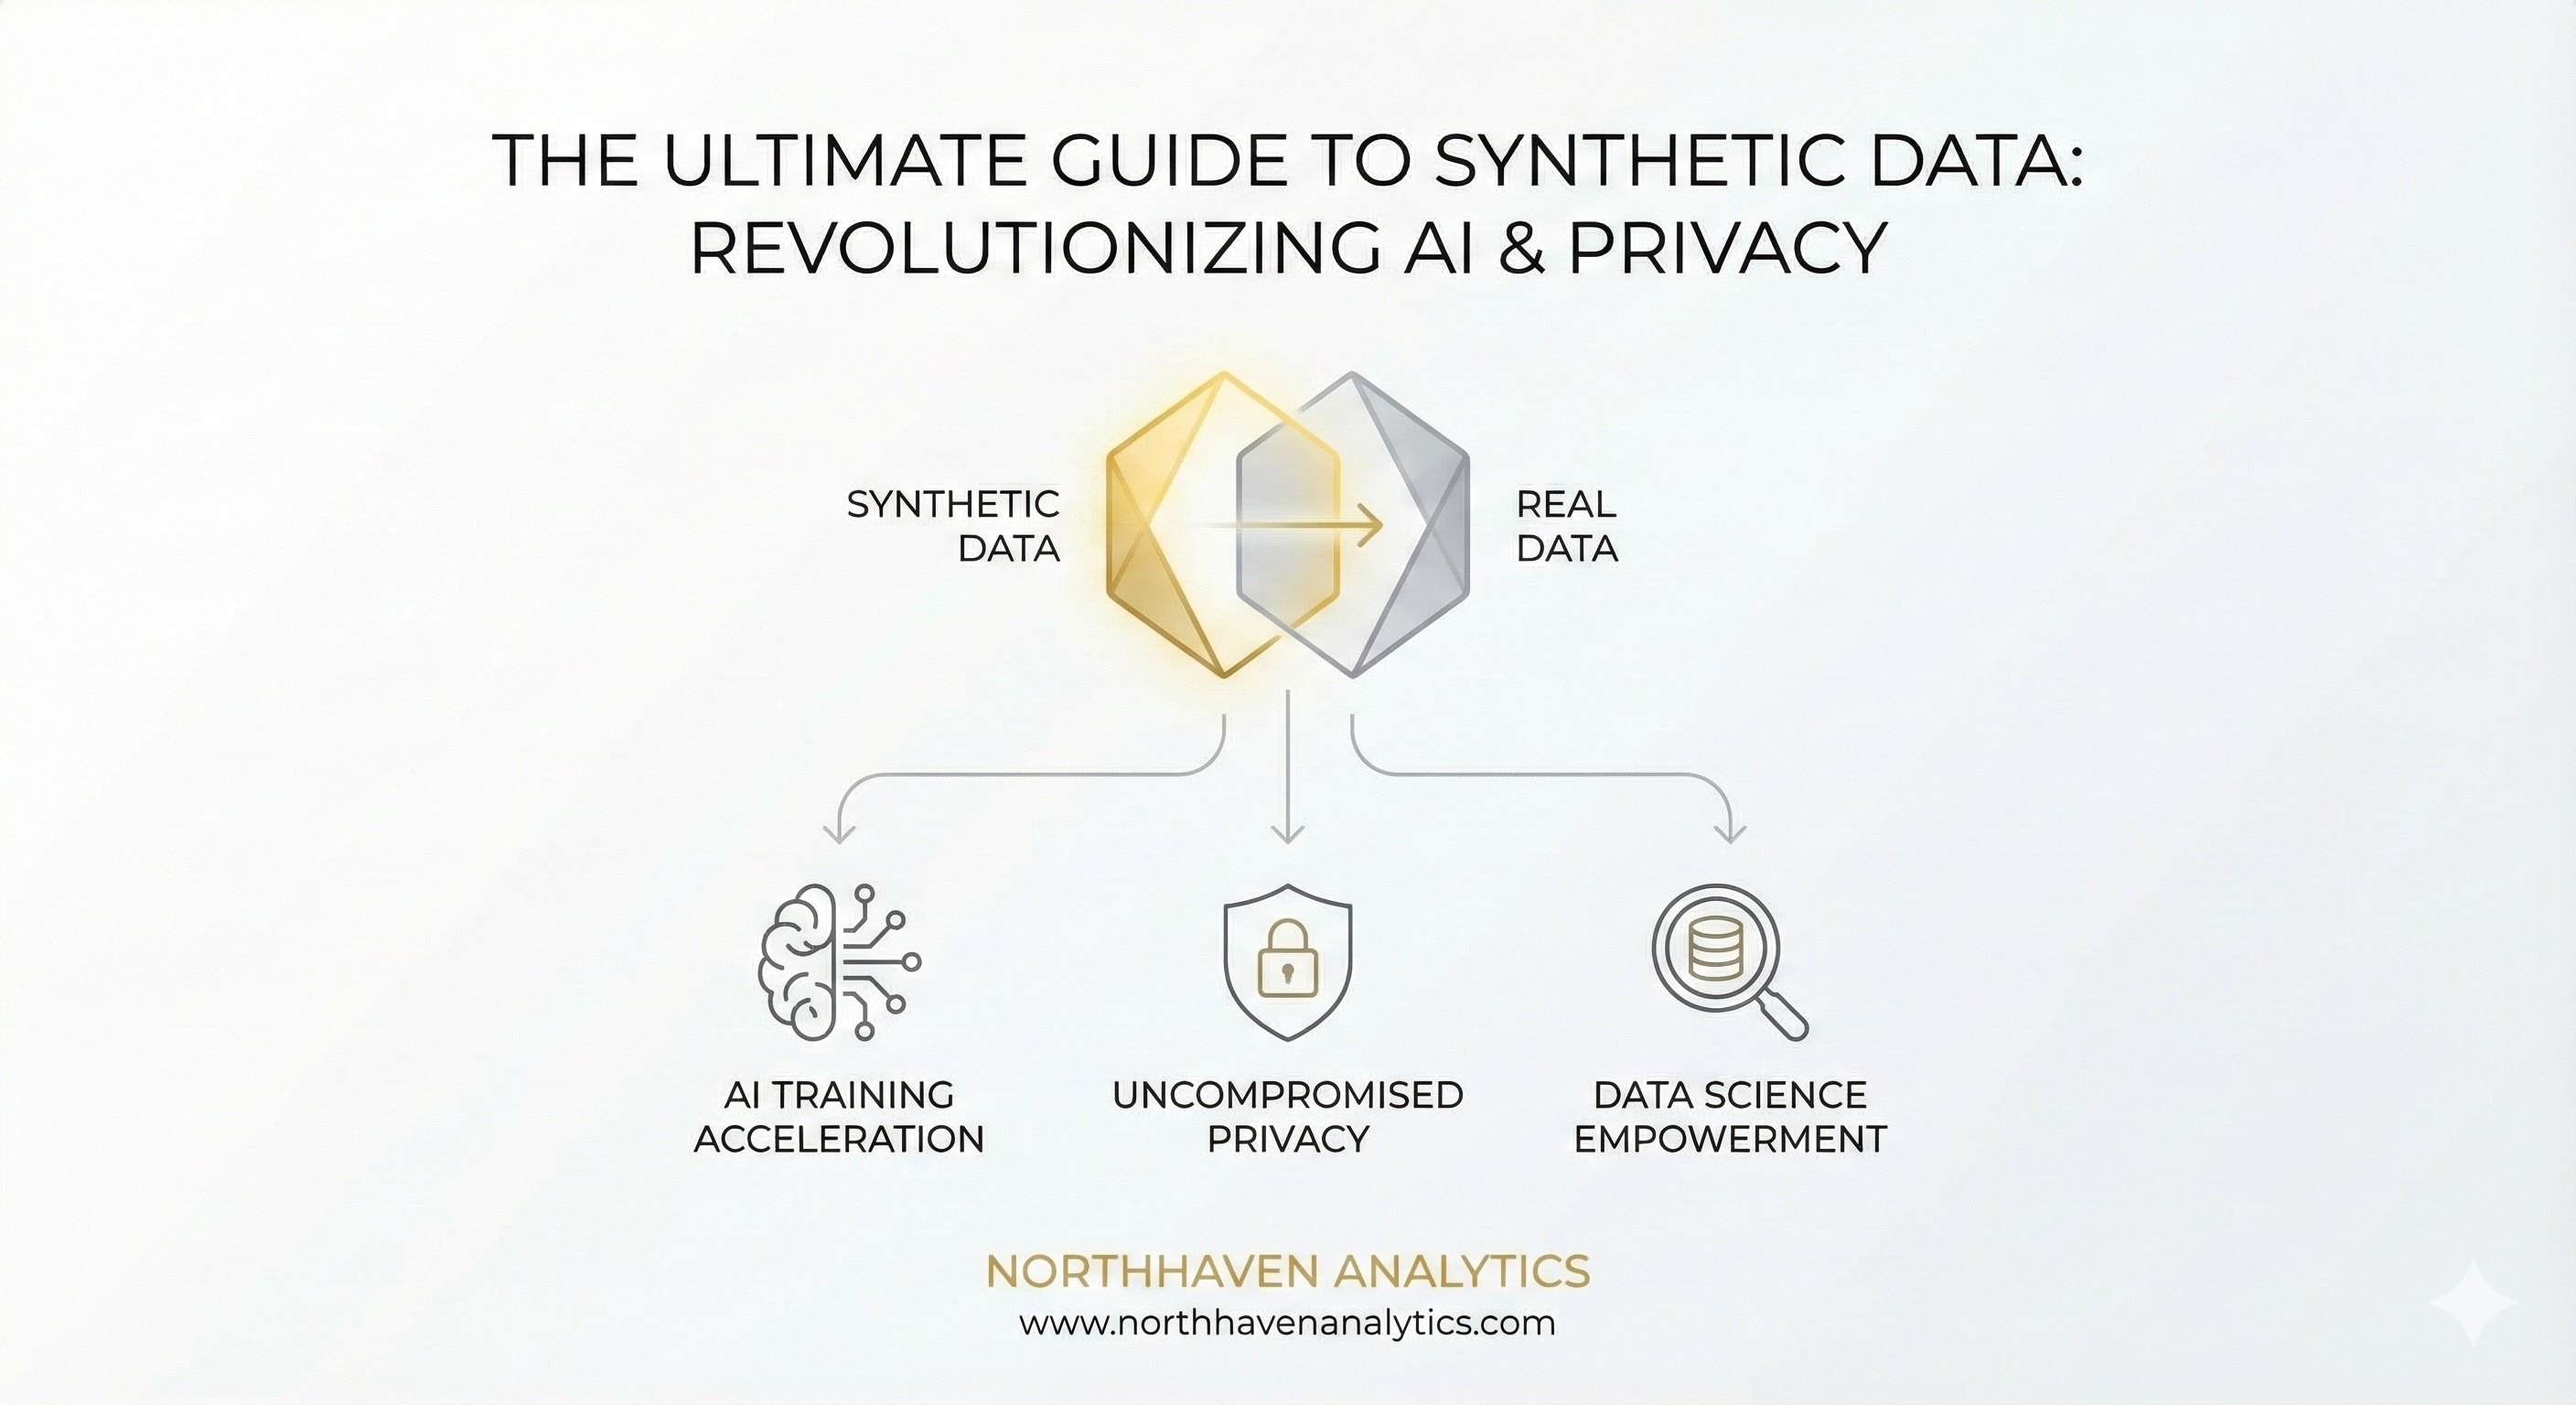
Unleashing the Power of Synthetic Data to Enhance Data Availability
When available data is insufficient or too risky to use, Northhaven Analytics generates synthetic data. Our methodology involves quant-driven data engineering. We do not just anonymize; we create entirely new data sets that are statistically identical to real historical data but contain no sensitive information.
- Scenario Engine: Our proprietary Scenario Engine allows you to compute different futures. You can systematically reshape a dataset to simulate stress, aggressive growth, or market crashes—something impossible with just historical data.
- Compliance-Safe: Our innovation allows banks to provide data to their internal AI teams without regulatory friction.
- Enterprise Grade: We curate and validate every file using a rigorous methodology that ensures statistical fidelity.
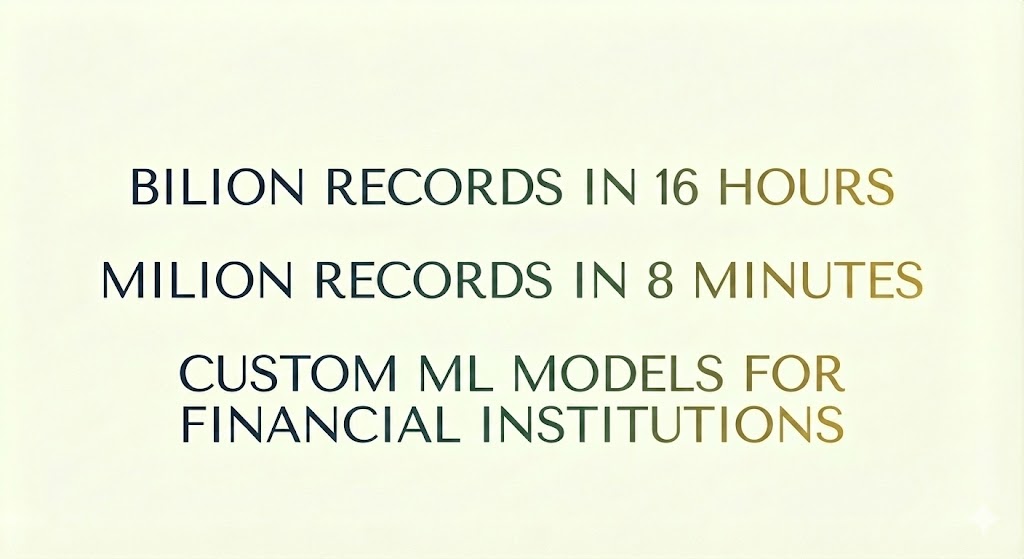
Dedicated ML Models and the Future of the Platform
We go beyond just providing data. We build Dedicated ML Models trained on this high-fidelity synthetic data. From fraud detection to credit scoring, our models allow you to analyze risk with unprecedented precision. Northhaven Analytics is the platform that bridges the gap between data sources and decision-making.
Conclusion: A Data-Driven Future for the Enterprise
The field of data science is evolving rapidly. To succeed in this new economy, organizations must master the flow of information. They must collect data efficiently from different sources, analyze it deeply using advanced analytics, and use data responsibly to drive innovation.
Whether you are consulting a World Bank indicator, running a SQL query on a database, or training a complex machine learning model, remember that every datum holds potential.
Northhaven Analytics empowers you to realize that potential. By providing useful information in the form of compliant, synthetic datasets, we help you navigate the digital economy with confidence. Don’t let privacy constraints limit your insight.
Explore Northhaven Analytics today—the platform where data meets innovation.
